Debugging with the SwingDebugScriptWindow
1 Registering a SwingDebugScriptWindow as a Debug listener
2 Creating a Debug session
3 The Debug window
3.1 The top panel
3.2 The bottom panel
3.2.1 Showing exceptions
3.2.2 Variables panel
4 Managing the Debug session
4.1 Adding or removing a breakpoint
4.2 Editing a breakpoint
5 See also
2 Creating a Debug session
3 The Debug window
3.1 The top panel
3.2 The bottom panel
3.2.1 Showing exceptions
3.2.2 Variables panel
4 Managing the Debug session
4.1 Adding or removing a breakpoint
4.2 Editing a breakpoint
5 See also
The SwingDebugScriptWindow is a Swing component which is a Debug listener.
It also implements both the ScriptExceptionListener and ScriptLogger interfaces, so it also manages the exceptions and loggings encountered during the Debug session.
The toolbar at the top of the window allows to control the execution of the script:
The output panel presents the output of the script, which are the script logs and exceptions. It presents the same content as both the DefaultSwingScriptLogger and the SwingExceptionListener
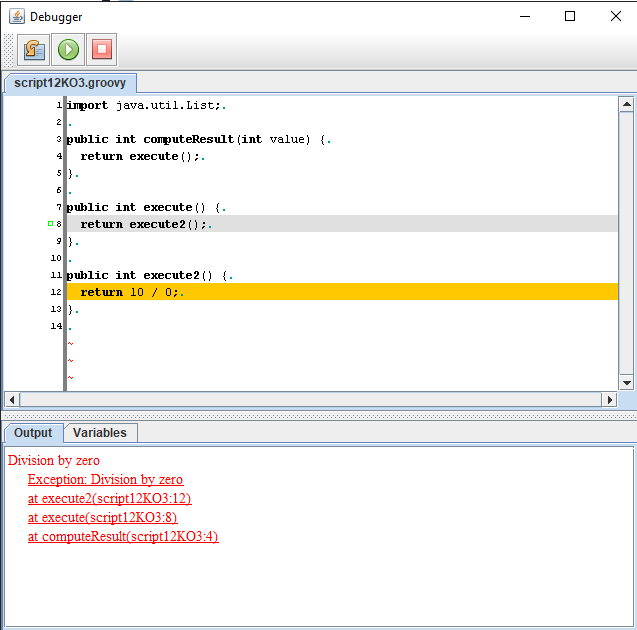
StackTraces are also shown and clicking on a StackTrace element allows to go to the associated line in the script. For example:
It also implements both the ScriptExceptionListener and ScriptLogger interfaces, so it also manages the exceptions and loggings encountered during the Debug session.
Registering a SwingDebugScriptWindow as a Debug listener
The first thing to do is to create a ScriptWrapper. For example, for the following interface in Groovy:public interface Script { public int computeResult(int value) { } }Let's create a Groovy wrapper:
   DebuggingWrapper<Script> wrapper = new GroovyScriptWrapper<Script>() {
   };
Now we will create a
SwingDebugScriptWindow and set it as a Debug listener of the wrapper:SwingDebugScriptWindow debugWindow = new SwingDebugScriptWindow(20, 20); debugWindow.setDefaultCloseOperation(JFrame.EXIT_ON_CLOSE); wrapper.setDebugListener(debugWindow);
Creating a Debug session
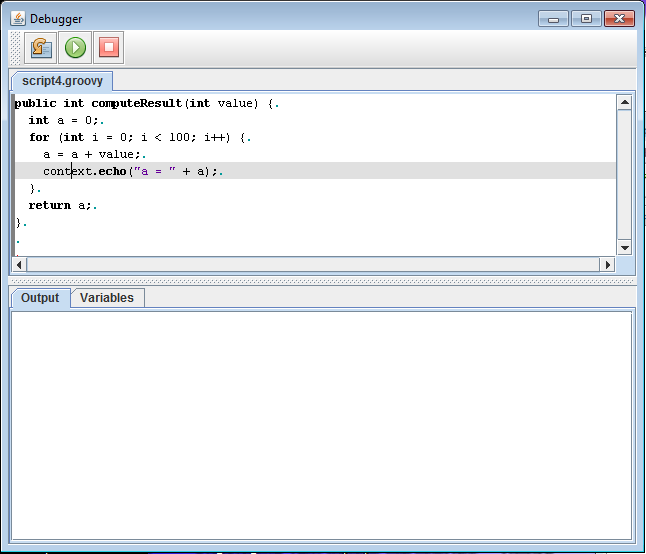
We will create a Debug session, theSwingDebugScriptWindow we registered will be used for this session.debugWindow.setVisible(true); File file = <the script> wrapper.initializeDebugSession(); wrapper.installScript(file); DebugSession<Script> session = wrapper.createDebugSession(); session.setExecutionMode(ScriptWrapper.MODE_NON_BLOCKING); session.setSessionHook(new SessionHook<Script>() { public void start(Script script) { script.computeResult(10); } }); session.startSession();We will have the following window:
The Debug window
The Debug window has two parts:- The top panel shows the script code
- The bottom panel shows the output and the variable windows
The toolbar at the top of the window allows to control the execution of the script:
-
 : This button allows to step over on the next instruction
 -
 : This button allows to continue the execution
 -
 : This button allows to end the debugging session
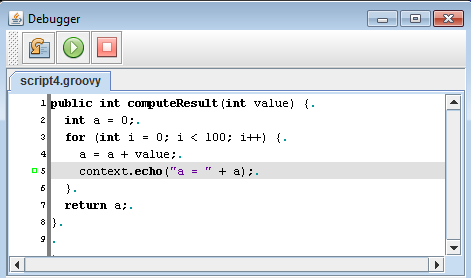
The top panel
The top panel shows the script. It is possible to show the line numbers by left-clicking on the left border of ther window and moving it to the right:
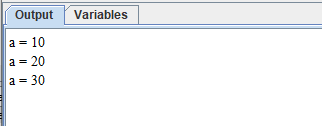
The bottom panel
The bottom panel shows two tabs:The output panel presents the output of the script, which are the script logs and exceptions. It presents the same content as both the DefaultSwingScriptLogger and the SwingExceptionListener
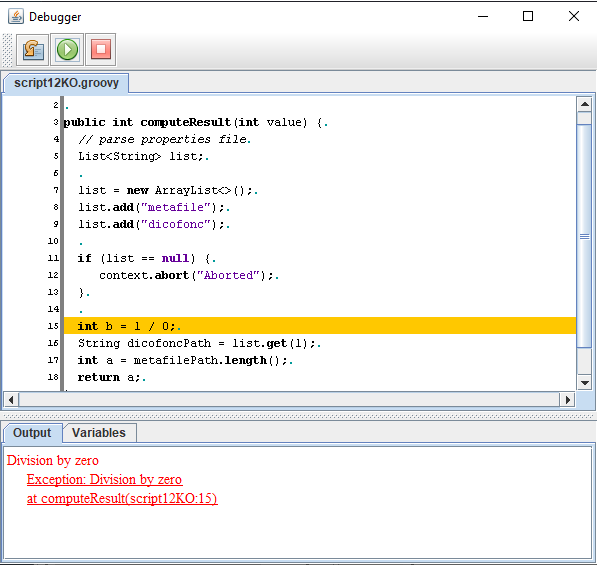
Showing exceptions
Then the first exception encountered during the compilation or execution of the script will popup the following window, for example:
StackTraces are also shown and clicking on a StackTrace element allows to go to the associated line in the script. For example:
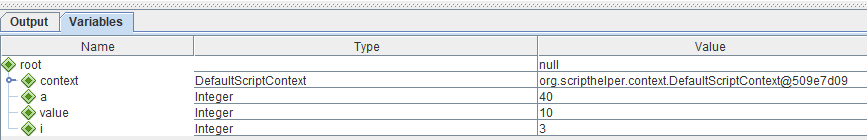
Variables panel
The variables panel presents the values of the variables which are defined in the current step:
Managing the Debug session
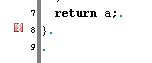
Clicking on the step or the continue button will start the script.Adding or removing a breakpoint
To add or remove a breakpoint, just right-click on the gutter:- The first click will add a breakpoint
- A second click will remove the breakpoint
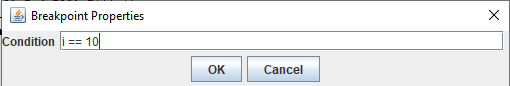
Editing a breakpoint
It is possible to edit a breakpoint to set a condition for the breakpoint to be active:
See also
- Swing utility classes: This article xplains how to integrate the script framework in swing
×
![]()
Categories: api | debugging | swing